Campus Building Waste Characterization & Opportunity Assessment
The Illinois Sustainable Technology Center (ISTC) Technical Assistance Program’s Zero Waste team conducted a Campus Building Waste Characterization & Opportunity Assessment (full report and executive summary available in the related documents area) to help F&S identify and measure the types of landfill (trash) and recycling material generated on campus.
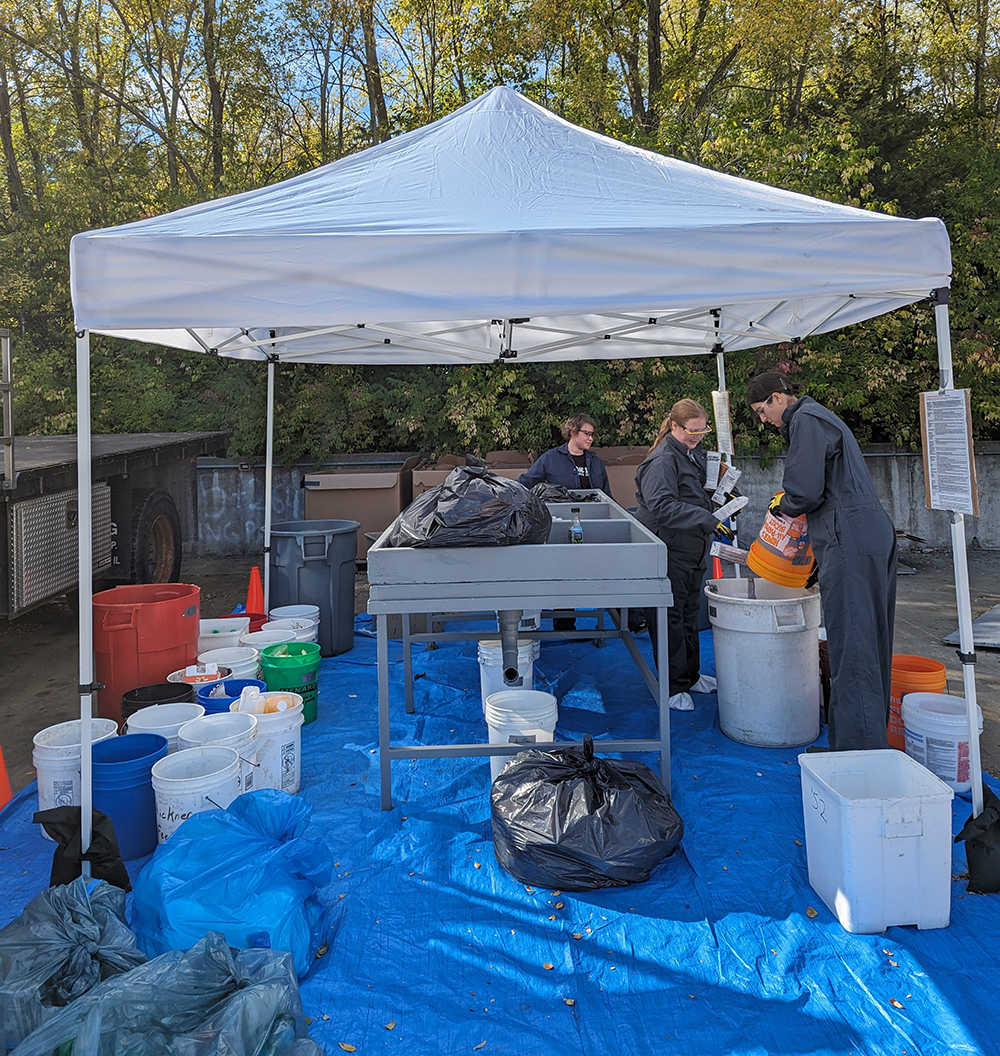
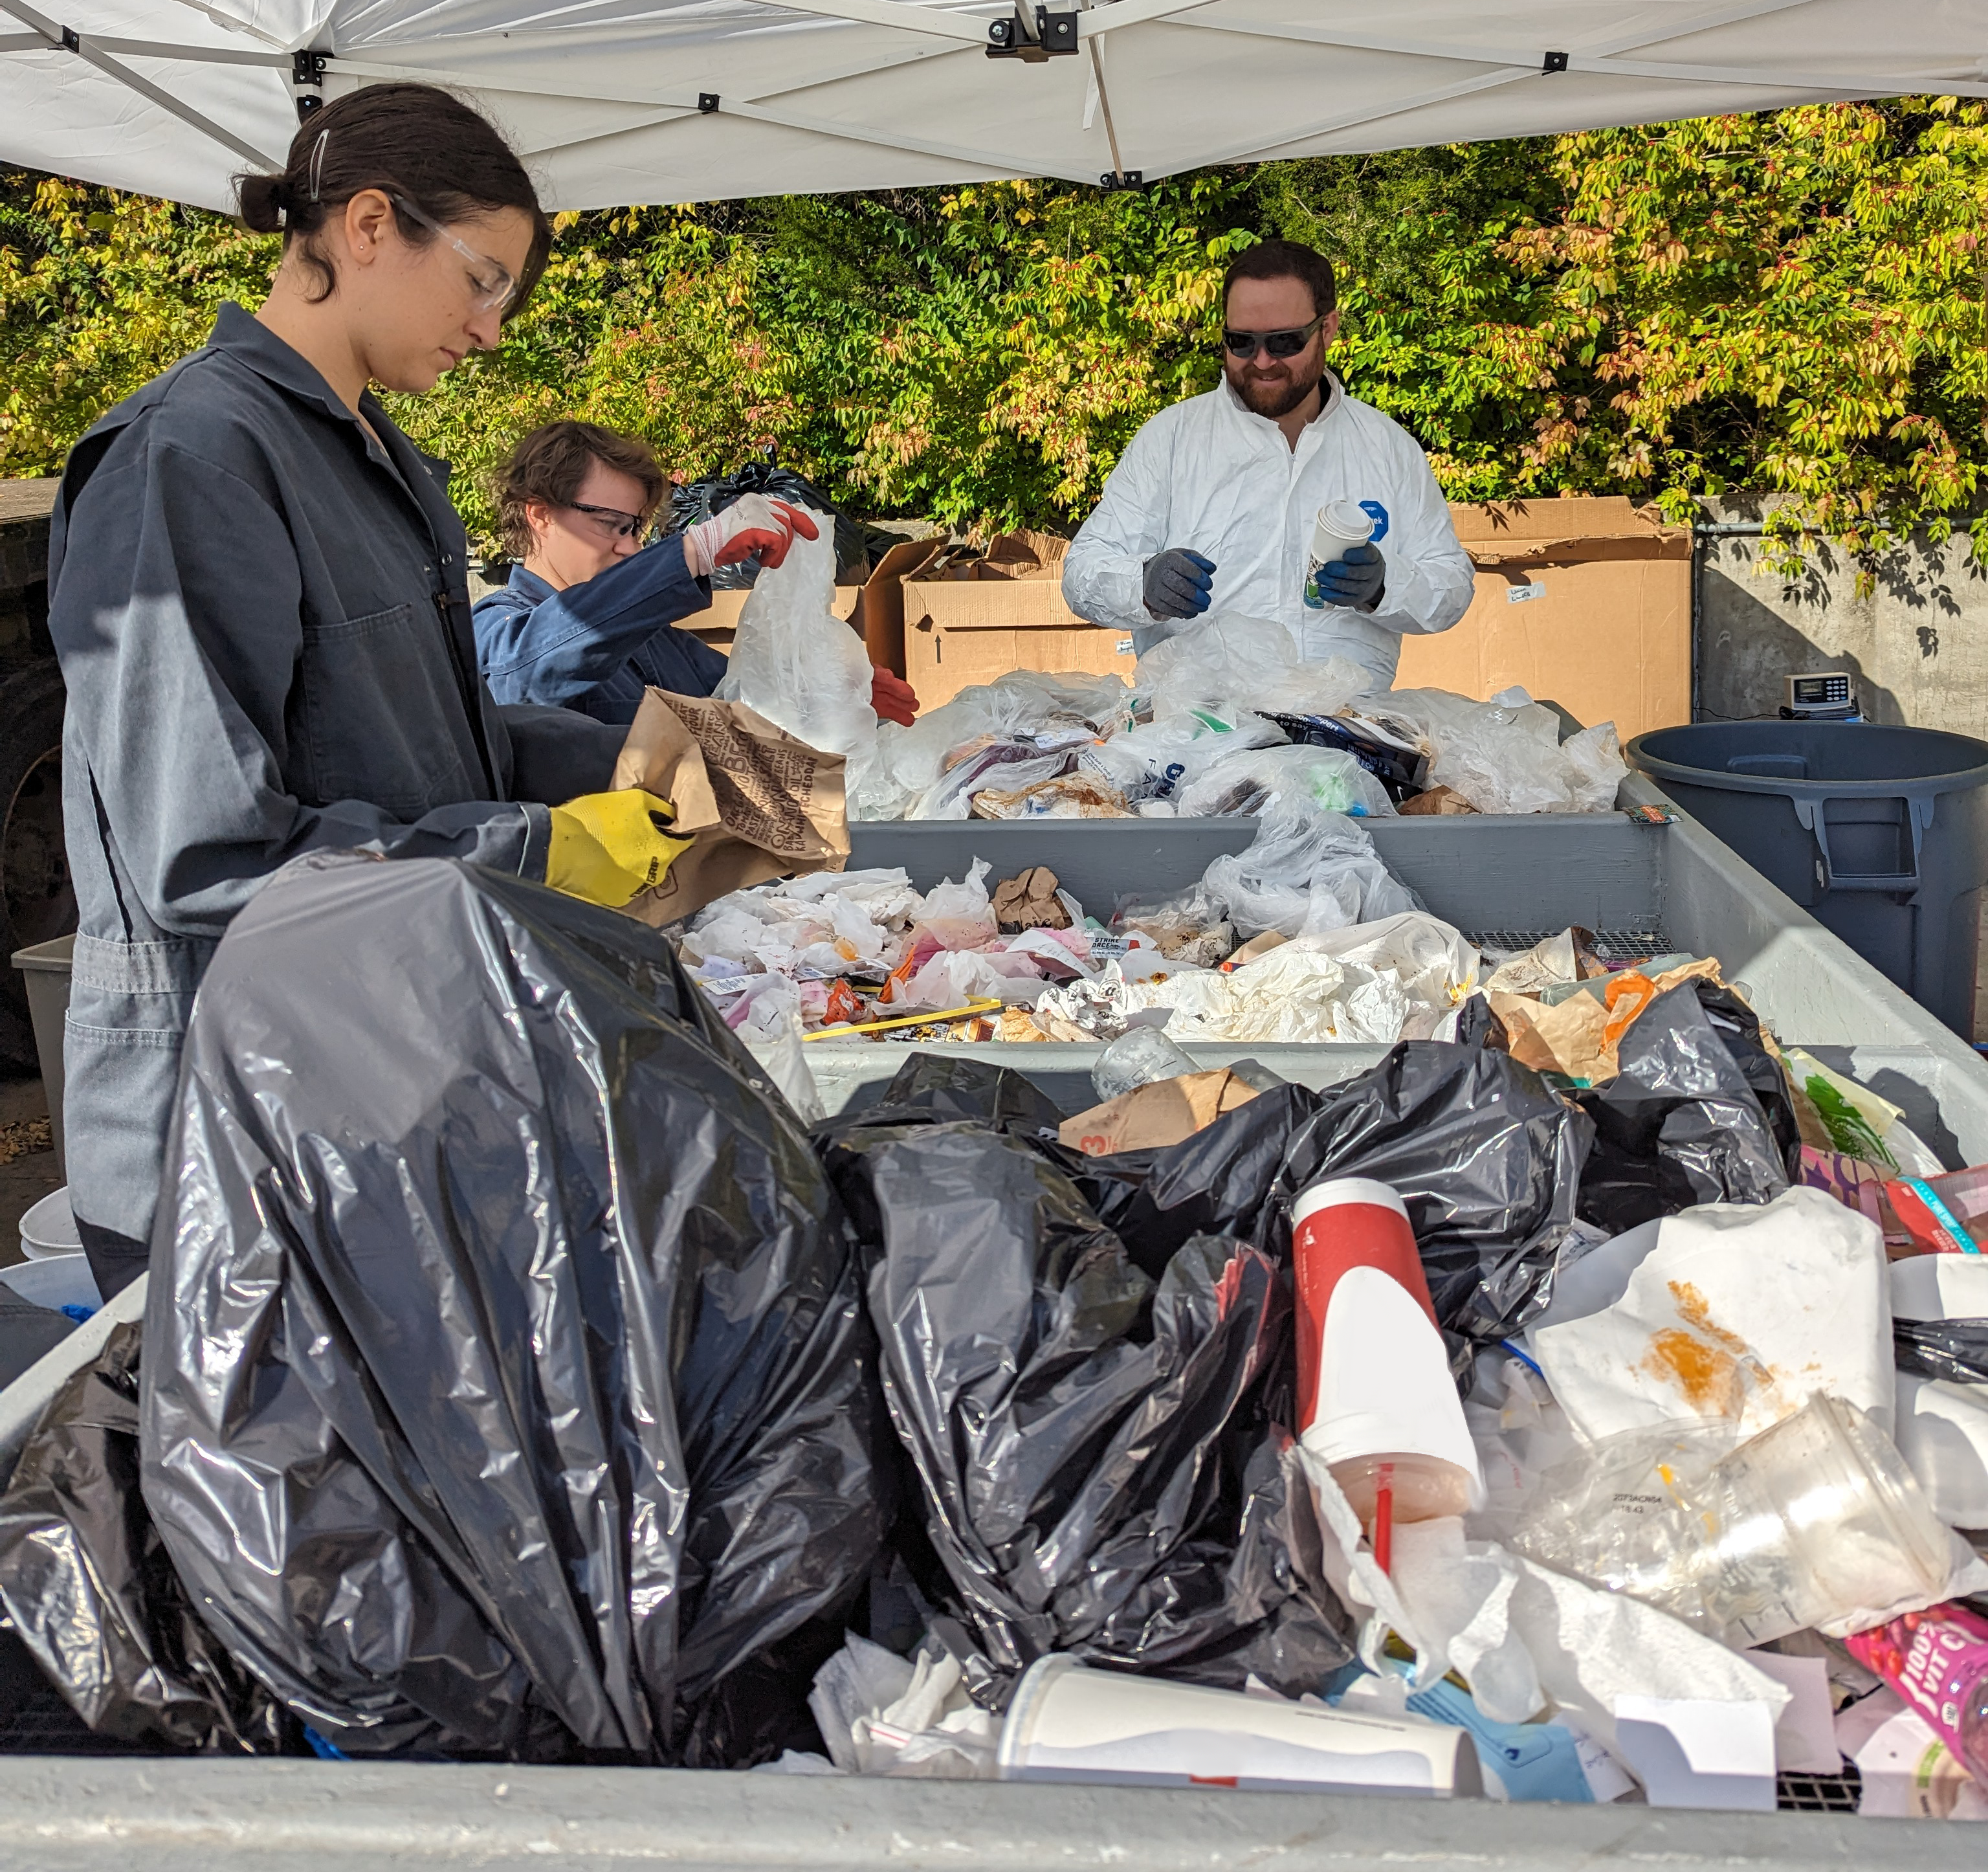
The audit involved hand-sorting materials from landfill-bound and recycling waste stream samples into predetermined material categories (e.g., cardboard, mixed paper, plastic bottles, other plastic containers, etc.) and weighing the amounts of each category present in the samples. Calculating the percentage of a sample waste stream represented by each material group, in turn, identified specific opportunities for waste prevention, reduction, and diversion.
Due to the size and volume of waste and recycling generated on campus, sorting all materials is not feasible. Thus, an “activity zone” approach was used for the audit. This involves selecting a representative set of buildings across campus based on the classification of a building according to its primary function and service. For this waste audit, four activity zones and eight respective buildings were included:
- Academic – Business Instructional Facility (BIF); Campus Instructional Facility (CIF)
- Academic + Laboratory – Roger Adams Laboratory (RAL); Noyes Laboratory
- Multi-Activity – Illini Union; Activities & Recreation Center (ARC)
- Student Living – Lincoln Avenue Residence Halls; Allen Residence Hall
Summary of Findings
Landfill Analysis
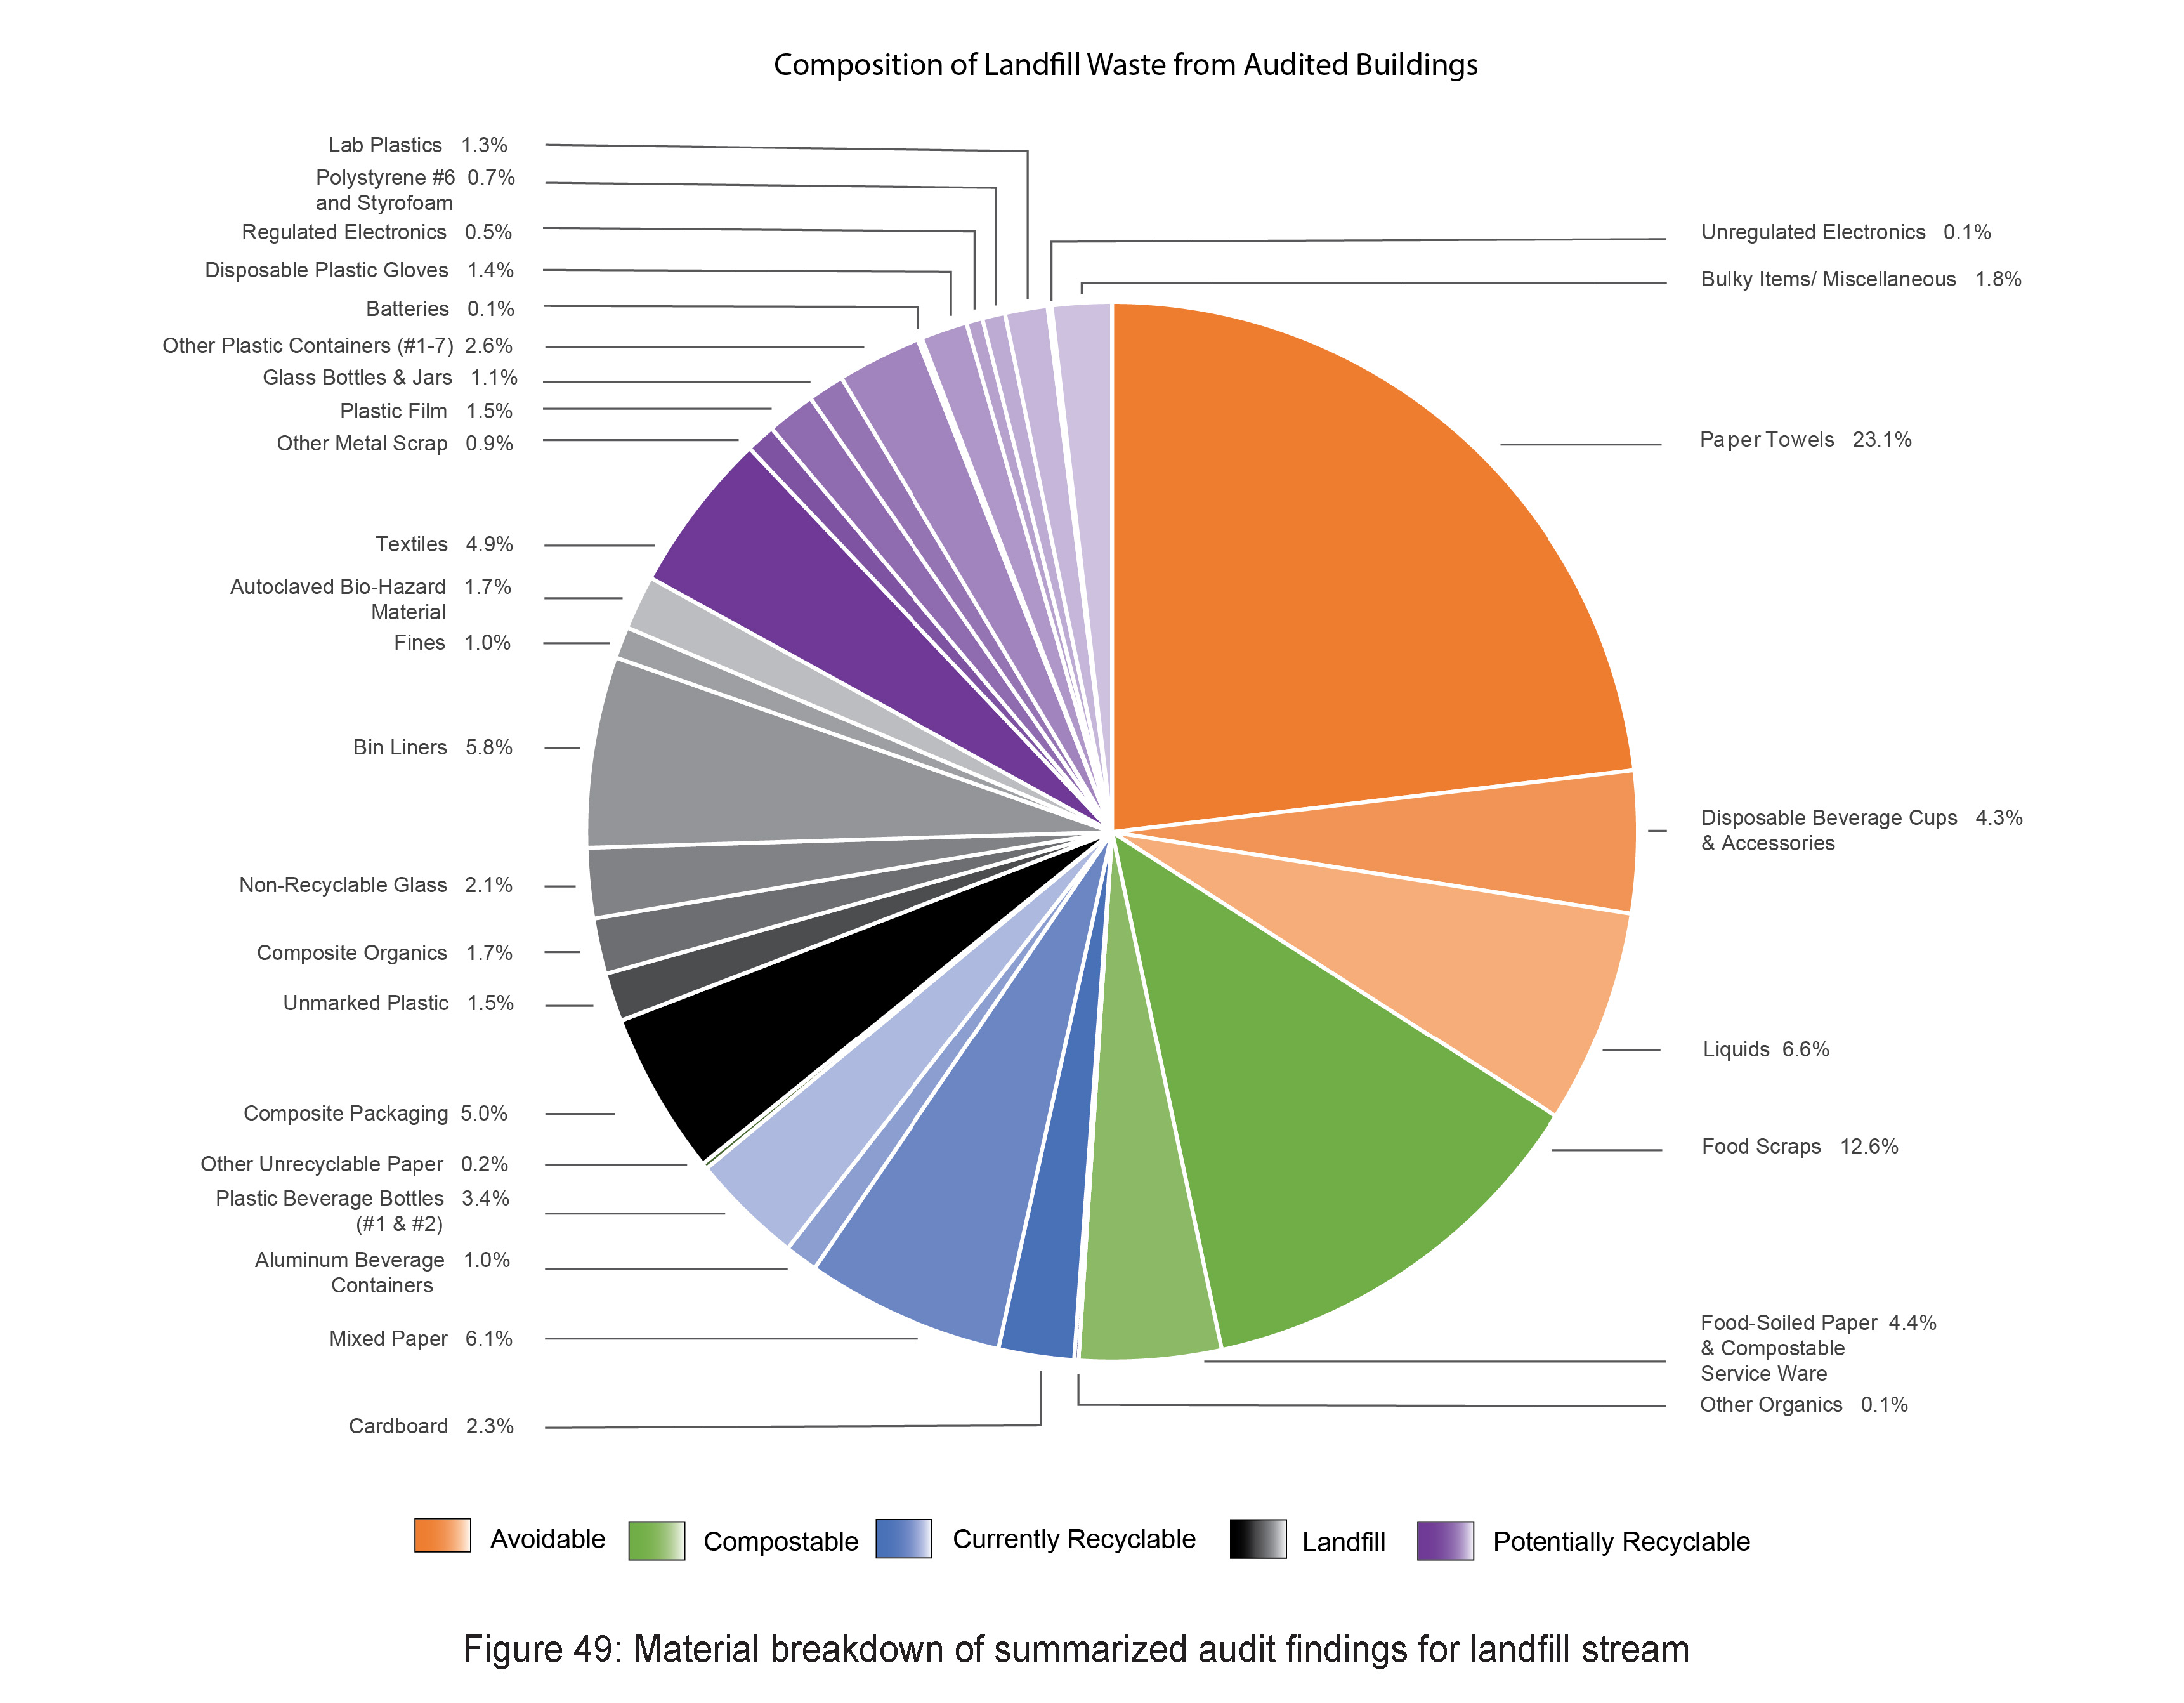
Within all 1742.3 pounds of landfill-found trash sorted across activity zones in this audit, only 18.9 percent had no other fate than being sent to the landfill. The avoidable amount was estimated to be 34 percent. Nearly 23.1 percent of all landfill waste was paper towels, which could be composted, recycled through a special program, or replaced by electric hand dryers instead of being trashed. Currently recyclable materials represented 12.9 percent of the waste stream, or 224.76 pounds of material. Another 17.1 percent might be recycled with expanded recycling programs. Finally, 17.1 percent was compostable.
Recycling Analysis

Within all 1065.7 pounds of material from recycling streams across activity zones sorted in this audit, 81.4 percent was correctly recycled; 62.3 percent of material sorted was cardboard. 18.6 percent is not currently accepted and is considered contamination. Liquids were the largest (by weight) material category contributing to contamination at 2.6 percentage of materials sorted. Liquid contamination can ruin even correctly recycled items; paper and cardboard must be clean and dry to be eligible for baling and sale as commodities.
Improvement Strategies
Based on operations at those buildings, 39 recommendations grouped into seven themes were identified in the assessment. You can read the full report, as well as the executive summary, on this page under “Documents.” Numerous hyperlinks within the recommendations are available in the PDF file.
Activity Zone Key: CW = Campus-wide | AC = Academic | ACL = Academic + Laboratory | MA = Multi-Activity |SL = Student Living
Responsible Party Key: F&S = Facilities & Services | FMs = Facility Managers | Stores = Central Stores & Receiving | DRS = Division of Research Safety |iSEE = Institute for Sustainability, Energy, and Environment | Campus Rec = Campus Recreation | DIA = Division of Intercollegiate Athletics
Education & Outreach
| Number | Strategy | Activity Zone | Impact | Responsible Party |
| 1 | Expand tours of the Waste Transfer Station to help the campus community better understand the recycling process. Require all existing BSWs (F&S coordinated & auxiliary) to tour the WTS. Make this part of onboarding new BSWs. Continue to advertise and facilitate WTS tours for faculty, staff and students. | CW | High | F&S, Auxillaries |
| 2 | Communicate bag color standards to all facility managers and BSWs (including auxiliary) via BSW manuals, training, direct communications, etc. This effort should be ongoing, and efforts should be made to gather feedback from BSWs. | CW | High | F&S, Auxillaries |
| 3 | Meet with departments/units to determine whether bag color standard is being followed in their buildings. Where it is not, work to understand and address barriers to implementation with those units and other relevant stakeholders (e.g. Purchasing, Central Stores, etc.) to address those barriers. | CW | High | FMs, Stores |
| 4 | Explore use of the Illinois App for sharing information on waste management and recycling procedures, barriers, challenges, lessons learned, linkage to the Recyclopedia (when released), etc. Different “groups” within the app could be formed for different segments of the campus community for targeted messaging and peer-to-peer networking and information sharing (e.g. BSWs, staff, faculty, undergraduate students, and graduate students). | CW | Medium | F&S, iSEE |
| 5 | Create a separate social media presence for F&S zero waste efforts to increase visibility of recycling, reuse, and diversion information on campus. | CW | High | F&S |
| 6 | Use campus digital signage network, new and existing e-bulletins, and social media to: Share waste reduction and recycling best practices with campus community members and dispel misconceptions. Provide instructions on how to contact F&S with questions (e.g., via recycling@illinois.edu). Inform campus community members about the iCAP portal. Consider presentations, videos, or online tutorials to help people understand how to navigate and submit suggested additions and/or revisions. | CW | High | F&S |
| 7 | Explore strategies to address liquid contamination in the recycling stream. Modify labels and signage on all collection bins for plastic beverage bottles and cans to instruct individuals to empty liquids before disposing of containers. Consider inclusion of QR codes for building-specific maps of for restrooms, water fountains, or other locations where liquids could be poured out. Develop an outreach campaign to underscore the role of liquids as a major contaminant in recycling and the importance of keeping liquids out of recycling bins. Pilot the use of liquid disposal bins near bottle and can collection bins in high-traffic areas (indoors and outdoors). See Arconas and CleanRiver for examples. | CW | High | F&S |
| 10 | Work with the Division of Research Safety(DRS), facility managers, and other departmental staff to communicate and enforce standard disposal methods of non-contaminated lab glass to improve safety for waste management staff. | ACL | Low | DRS |
| 11 | Improve battery recycling on campus. Update public-facing battery recycling map on the iCAP portal through collaboration with existing departments. Seek funding to support campus coordination for recycling of single-use batteries. Consult with DRS to clarify their battery recycling services and promote this as appropriate. Use campus digital signage, e-bulletins, newsletters, and social media to educate departments/units about recycling options they might pursue (e.g., Call2Recycle). Consult with University Purchasing about highlighting single use batteries made from recycled materials for which manufacturer recycling programs are also available in iBuy and purchasing guidelines. | CW | Low | F&S, DRS, Hosuing, FMs |
| 18 | Educate campus on reducing generation and increasing recycling of mixed paper. Refer to Illinois Green Libraries: Paper Use and Recycling for ideas, including: Printing only when necessary Make double-sided printing the default on all campus printers Digitizing information where possible Purchasing recycled-content paper Ensure paper recycling bins are adjacent to all printing stations | CW | Medium | University Libraries, Document Services |
| 21 | Publicize F&S green cleaning efforts to improve awareness of waste reduction aspects via EWeek, digital signage, social media, etc. | CW | Low | F&S |
| 25 | Encourage collaboration between students and staff in residence halls to improve communication related to recycling. Mobilize Sustainability LLC to work with Housing’s Residential Life department on posting F&S approved, clear signage to improve collection and source separation of recyclables in residence halls. Develop Resident Advisor (RA) training related to proper recycling to empower them to train student residents on correct procedures. | SL | Medium | Housing |
| 27 | Work to update and standardize recycling and trash collection signage across campus buildings and floors using accurate, accessible signage that provides options for more information online. Consider partnering with specific buildings to pilot clear communication for the handling of materials that vary from building to building based on space/infrastructure. Conduct a bin audit of all MaxR three-bin stations to ensure that icons and labels coincide with other messaging from F&S regarding whether or not cardboard is acceptable in paper recycling bins and the fact that glass bottles are not currently acceptable in bins for collecting plastic beverage bottles and cans. Provide clear avenues for departments and individuals to print additional copies of recent, accurate signage. Prioritize accessibility for the go.illinois.edu/recycling homepage, including ability to search for individual materials. Consider including information on the bag standard and “Frequently Asked Questions” regarding common concerns of building occupants. Consider multilingual accessibility of materials. | CW | High | F&S, Auxiliaries, FMs |
| 29 | Improve student involvement as individuals, classes and organizations (e.g., sustainability-focused clubs, the Sustainability LLC, etc.) in raising awareness of and participation in campus programs. Invite students to create resources, volunteer for programming, and put on events related to sustainable behaviors. | CW | High | iSEE, Housing |
| 31 | Work with the Green Research Committee to compile information on recycling programs for various types of common lab plastics (e.g., relevant Terracycle programs, Mailthisback by Corning, Agilent instrument buyback, and MilliporeSigma recycling programs. Make this information available online and promote to key campus departments. | ACL | High | F&S, DRS |
| 32 | Foster lab plastic waste reduction by working with the Green Research Committee and University Purchasing to identify reusable, non-plastic alternatives for common lab plastics as well as common lab consumables with reduced plastic packaging available through approved vendors. Make this information available online and promote to key campus departments via integration into iBuy as part of a larger sustainable purchasing policy for lab-related products. Work with the Department of Chemistry to expand nitrile glove recycling via RightCycle to more of its labs and encourage labs in other departments to emulate their efforts. | ACL | High | F&S, University Purchasing |
Infrastructure
| Number | Strategy | Activity Zone | Impact | Responsible Party |
| 7 | Explore strategies to address liquid contamination in the recycling stream. Modify labels and signage on all collection bins for plastic beverage bottles and cans to instruct individuals to empty liquids before disposing of containers. Consider inclusion of QR codes for building-specific maps of for restrooms, water fountains, or other locations where liquids could be poured out. Develop an outreach campaign to underscore the role of liquids as a major contaminant in recycling and the importance of keeping liquids out of recycling bins. Pilot the use of liquid disposal bins near bottle and can collection bins in high traffic areas (indoors and outdoors). See Arconas and CleanRiver for examples. | CW | High | F&S |
| 8 | Consider reducing the number of deskside trash and recycling bins in office spaces, encouraging office occupants to take items for disposal to bins in hallways and other common areas where standardized signage and labels could more clearly convey what items belong in each bin. This might decrease confusion around acceptable recyclables and proper practices while also reducing the total number of plastic bin liners used and thus sent to landfill. | AC, ACL, MA | Medium | F&S, Auxiliaries, FMs |
| 12 | Explore multiple strategies to reduce and/or recycle paper towel waste. Conduct a pilot of Essity’s Tork Paper Circle paper towel recycling program to divert paper towel waste, preferably in a high-volume generation area where towels cannot be completely eliminated through provision of electric hand dryers or use of launderable cloths for surface cleaning. Explore efficient bathroom appliances that will cut down on toilet paper and paper towel waste such as hand dryers, foot door openers, trifold paper towel holders, bidets and one-at-a-time toilet paper roll holders that may reduce the likelihood of needing to replace still usable rolls. Consult with the City of Urbana to explore the feasibility of composting used paper towels from food service operations and restrooms at the Landscape Recycling Center. | CW | High | F&S |
| 24 | Work with faculty and student researchers to ideate and explore the feasibility of both low and high-tech upgrades to the WTS for improving sorting efficiency and capacity. Consider expansion of the list of plastic types (beyond resin codes #1) accepted for recycling on campus. This may depend upon the results of Dr. Nishant Garg’s exploration of automated sorting with computer vision, as that technology could address sorting staff capacity limitations. If storage space for collected recyclables is a barrier, consult with local governments and their approved waste haulers to see if collaboration is possible. | CW | High | F&S |
| 27 | Work to update and standardize recycling and trash collection signage across campus buildings and floors using accurate, accessible signage that provides options for more information online. Consider partnering with specific buildings to pilot clear communication for the handling of materials that vary from building to building based on space/infrastructure. Conduct a bin audit of all MaxR three-bin stations to ensure that icons and labels coincide with other messaging from F&S regarding whether or not cardboard is acceptable in paper recycling bins and the fact that glass bottles are not currently acceptable in bins for collecting plastic beverage bottles and cans. Provide clear avenues for departments and individuals to print additional copies of recent, accurate signage. Prioritize accessibility for the go.illinois.edu/recycling homepage, including ability to search for individual materials. Consider including information on the bag standard and “Frequently Asked Questions” regarding common concerns of building occupants. Consider multilingual accessibility of materials. | CW | High | F&S, Auxiliaries, FMs |
| 28 | Continue to standardize bin infrastructure by encouraging the replacement of existing bins with MaxR or other multi-bin stations. Ensure funding to achieve iCAP goals related to indoor bin updates. | CW | High | F&S, Auxiliaries |
| 39 | For buildings at which dock space limitations currently necessitate the placement of flattened cardboard into landfill dumpsters for later reclamation on the WTS sorting line, work with building occupants and assigned BSWs to explore ways to keep source separated cardboard free of contamination. This might include instructing BSWs to place cardboard into blue bin liners before putting it into the landfill dumpster, to keep it clean and facilitate its removal from the WTS tip floor. Building occupants/departments/units might also be encouraged to use a separate toter inside the building to consolidate cardboard for delivery to the cardboard/newspaper drop off in Lot E14. | CW | Medium | F&S, Auxiliaries, FMs |
Programming
| Number | Strategy | Activity Zone | Impact | Responsible Party |
| 7 | Explore strategies to address liquid contamination in the recycling stream. Modify labels and signage on all collection bins for plastic beverage bottles and cans to instruct individuals to empty liquids before disposing of containers. Consider inclusion of QR codes for building-specific maps of for restrooms, water fountains, or other locations where liquids could be poured out. Develop an outreach campaign to underscore the role of liquids as a major contaminant in recycling and the importance of keeping liquids out of recycling bins. Pilot the use of liquid disposal bins near bottle and can collection bins in high-traffic areas (indoors and outdoors). See Arconas and CleanRiver for examples. | CW | High | F&S |
| 9 | Assess feasibility of options for reducing bin liner waste via pilot projects, e.g., emptying recycling bins without removing bin liners; eliminating bin liners where possible; and/or using reusable, washable bin liners. | CW | Medium | F&S, Auxiliaries |
| 11 | Improve battery recycling on campus. Update public-facing battery recycling map on the iCAP portal through collaboration with existing departments. Seek funding to support campus coordination for recycling of single-use batteries. Consult with DRS to clarify their battery recycling services and promote this as appropriate. Use campus digital signage, e-bulletins, newsletters, and social media to educate departments/units about recycling options they might pursue (e.g., Call2Recycle). Consult with University Purchasing about highlighting single-use batteries made from recycled materials for which manufacturer recycling programs are also available in iBuy and purchasing guidelines. | CW | Low | F&S, DRS, Housing, FMs |
| 14 | Restart plastic bag recycling program using existing collection infrastructure at Union and LAR, updating signage and raising awareness to reduce contamination and increase usage. Consider adding additional drop-off locations or expanding the program to a campus wide film recycling effort, based on success at pilot sites. See Nextrex and UMBC resources. The UMBC Office of Sustainability has offered to share their experiences and lessons learned. | CW | Medium | Illini Union, Housing |
| 15 | Explore options to restart 3D filament recycling program at BIF and pilot replication at other 3D printing labs on campus. Options might include the use of on-site recycling equipment (e.g., a Filabot, which other universities have successfully used), Terracycle zero waste boxes, or other mail-in recycling services. | AC | Low | University Maker Spaces |
| 16 | Coordinate collection and donation of lost and found collections at campus buildings, perhaps in conjunction with existing Dump & Run activities. | CW | Low | F&S, FMs |
| 17 | Explore strategies to reduce single use food and beverage packaging. Work with University Purchasing and retailers operating on campus property to establish reusable alternatives for disposable cups and other food service packaging. For example, Starbucks has piloted reusable cups and might be willing to discuss/explore the feasibility of their use on campus. Systems such as r.cup have been deployed in Seattle movie theaters and other entertainment venues and use of this or something similar on campus could be considered. Explore expansion of Freestyle beverage vending (such as those in the Quad Shop at the Illini Union and in dining halls) along with reusable cups to reduce generation of single-use plastic beverage bottles. | CW | High | Illini Union, Vending Maching Vendors, Housing, Dining, Athletics |
| 24 | Work with faculty and student researchers to ideate and explore the feasibility of both low and high tech upgrades to the WTS for improving sorting efficiency and capacity. Consider expansion of the list of plastic types (beyond resin codes #1) accepted for recycling on campus. This may depend upon the results of Dr. Nishant Garg’s exploration of automated sorting with computer vision, as that technology could address sorting staff capacity limitations. If storage space for collected recyclables is a barrier, consult with local governments and their approved waste haulers to see if collaboration is possible. | CW | High | F&S |
| 26 | Consult with Housing Dining Services to determine if food cans generated by student residents and consolidated in trash/recycling rooms could be incorporated into dining hall food can collections that F&S picks up in bulk for scrap metal recycling. If feasible, work with Residential Life on appropriate messaging for student residents. | SL | Low | Housing |
| 33 | Work with the Department of Chemistry to expand nitrile glove recycling via RightCycle to more of its labs and encourage labs in other departments to emulate their efforts. | ACL | High | FMs |
| 34 | Work with Housing to re-establish nitrile glove recycling, exploring the feasibility of alternatives to the Kimberly Clark RightCycle program, including Terracycle or Medline mail-in boxes. | SL | Medium | Housing |
| 35 | Work with BSWs (F&S and auxiliary unit coordinated) to pilot recycling of the nitrile gloves they use when emptying building bins. Consider the use of a small bin (as in this example) hanging from Brute containers on BSW carts for glove collection. | CW | Medium | F&S, Auxiliaries |
| 36 | Consider working with student organizations and/or iSEE to expand existing and pilot new Terracycle zero waste pallet bag collections for common wastes generated on campus (e.g., the Pens, Pencils, and Markers Zero Waste Pallet). | CW | Low | F&S, FMs |
Policy
| Number | Strategy | Activity Zone | Impact | Responsible Party |
| 9 | Assess feasibility of options for reducing bin liner waste via pilot projects, e.g., emptying recycling bins without removing bin liners; eliminating bin liners where possible; and/or using reusable, washable bin liners. | CW | Medium | F&S, Auxilliaries |
| 13 | Work with Campus Recreation to explore disposable wipe waste reduction through alternative procedures for cleaning exercise equipment between users. For example, paper towels and spray bottles of cleaners might be offered instead, along with a pilot of paper towel recycling through Tork Paper Circle (as suggested above). Another option would be to provide spray bottles of cleaner and employ a cloth gym towel laundering service. | MA | High | Campus Rec |
| 19 | Work with facility managers, University Purchasing, and retailers operating on campus property to increase recycling. Establish recycling protocols for materials accepted for recycling on campus (e.g. the recycling of milk jugs by the Starbucks at the Illini Union). Explore contract language requiring retailers to recycle. | CW | Medium | Illini Union, University Purchasing, FMs |
| 39 | For buildings at which dock space limitations currently necessitate the placement of flattened cardboard into landfill dumpsters for later reclamation on the WTS sorting line, work with building occupants and assigned BSWs to explore ways to keep source separated cardboard free of contamination. This might include instructing BSWs to place cardboard into blue bin liners before putting it into the landfill dumpster, to keep it clean and facilitate its removal from the WTS tip floor. Building occupants/departments/units might also be encouraged to use a separate toter inside the building to consolidate cardboard for delivery to the cardboard/newspaper drop off in Lot E14. | CW | Medium | F&S, Auxiliaries, FMs |
Purchasing
| Number | Strategy | Activity Zone | Impact | Responsible Party |
| 13 | Work with Campus Recreation to explore disposable wipe waste reduction through alternative procedures for cleaning exercise equipment between users. For example, paper towels and spray bottles of cleaners might be offered instead, along with a pilot of paper towel recycling through Tork Paper Circle (as suggested above). Another option would be to provide spray bottles of cleaner and employ a cloth gym towel laundering service. | MA | High | Campus Rec |
| 17 | Explore strategies to reduce single use food and beverage packaging. Work with University Purchasing and retailers operating on campus property to establish reusable alternatives for disposable cups and other food service packaging. For example, Starbucks has piloted reusable cups and might be willing to discuss/explore the feasibility of their use on campus. Systems such as r.cup have been deployed in Seattle movie theaters and other entertainment venues and use of this or something similar on campus could be considered. Explore expansion of Freestyle beverage vending (such as those in the Quad Shop at the Illini Union and in dining halls) along with reusable cups to reduce generation of single-use plastic beverage bottles. | CW | High | Illini Union, Vending Machine Vendors, Housing, Dining, Athletics |
| 19 | Work with facility managers, University Purchasing, and retailers operating on campus property to increase recycling. Establish recycling protocols for materials accepted for recycling on campus (e.g. the recycling of milk jugs by the Starbucks at the Illini Union). Explore contract language requiring retailers to recycle. | CW | Medium | Illini Union, University Purchasing, FMs |
| 20 | Work with University Purchasing (and possibly the zero waste iCAP team and/or iSEE interns) to consult with BSWs, campus units and departments to understand and address issues related to waste management supply purchasing and environmentally preferable purchasing options in general, in both iBuy and from external vendors. Use feedback collected to develop specific sustainable purchasing policies for relevant product categories. | CW | High | F&S, University Purchasing |
| 32 | Foster lab plastic waste reduction by working with the Green Research Committee and University Purchasing to identify reusable, non-plastic alternatives for common lab plastics as well as common lab consumables with reduced plastic packaging available through approved vendors. Make this information available online and promote to key campus departments via integration into iBuy as part of a larger sustainable purchasing policy for lab-related products. Work with the Department of Chemistry to expand nitrile glove recycling via RightCycle to more of its labs and encourage labs in other departments to emulate their efforts. | ACL | High | FMs |
Retail
| Number | Strategy | Activity Zone | Impact | Responsible Party |
| 17 | Explore strategies to reduce single-use food and beverage packaging. Work with University Purchasing and retailers operating on campus property to establish reusable alternatives for disposable cups and other food service packaging. For example, Starbucks has piloted reusable cups and might be willing to discuss/explore the feasibility of their use on campus. Systems such as r.cup have been deployed in Seattle movie theaters and other entertainment venues and use of this or something similar on campus could be considered. Explore expansion of Freestyle beverage vending (such as those in the Quad Shop at the Illini Union and in dining halls) along with reusable cups to reduce generation of single-use plastic beverage bottles. | CW | High | Illini Union, Vending Machine Vendors, Housing, Dining, Athletics |
| 19 | Work with facility managers, University Purchasing, and retailers operating on campus property to increase recycling. Establish recycling protocols for materials accepted for recycling on campus (e.g. the recycling of milk jugs by the Starbucks at the Illini Union). Explore contract language requiring retailers to recycle. | CW | Medium | Illini Union, University Purchasing, FMs |
Research
| Number | Strategy | Activity Zone | Impact | Responsible Party |
| 20 | Work with University Purchasing (and possibly the zero waste iCAP team and/or iSEE interns) to consult with BSWs, campus units and departments to understand and address issues related to waste management supply purchasing and environmentally preferable purchasing options in general, in both iBuy and from external vendors. Use feedback collected to develop specific sustainable purchasing policies for relevant product categories. | CW | High | F&S, University Purchasing |
| 22 | Work with the Champaign County Environmental Stewards (CCES) and local governments to explore solutions for materials such as glass, plastic film, and expanded polystyrene. | CW | Medium | F&S |
| 23 | Work with the Champaign County Environmental Stewards (CCES) and local governments to explore solutions for management of organic waste (including food waste, animal bedding, manure, etc.). | CW | Medium | F&S |
| 24 | Work with faculty and student researchers to ideate and explore the feasibility of both low and high-tech upgrades to the WTS for improving sorting efficiency and capacity. Consider expansion of the list of plastic types (beyond resin codes #1 & #2) accepted for recycling on campus. This may depend upon the results of Dr. Nishant Garg’s exploration of automated sorting with computer vision, as that technology could address sorting staff capacity limitations. If storage space for collected recyclables is a barrier, consult with local governments and their approved waste haulers to see if collaboration is possible. | CW | High | F&S |
| 30 | Work with the Green Research Committee to identify and develop sterilization and reuse protocols for common types of lab plastics (e.g. conical tubes, pipette tips, etc.) and promote these practices to campus labs. See the MyGreenLab Website for more information. Promote the existence of the Green Research Committee to key campus departments. | ACL | High | F&S, DRS |
| 37 | Consider additional campus building waste audits and stakeholder engagement (e.g. surveys, focus groups, etc.) particularly for auxiliary units and/or buildings not included in previously examined activity zones (e.g. athletic facilities/venues, libraries, theaters/performance venues, etc.). These audits could potentially be conducted by F&S staff and student interns to keep costs down. | CW | Medium | F&S, Auxiliaries |
| 38 | Create a list of all materials diverted from landfill by F&S (not just the five main recyclables, but all materials diverted, such as pallets, used motor oil, etc.). Create a map illustrating transportation of those materials from campus to processing sites and assess associated carbon emissions. | CW | Low | F&S |
Presentation Video: How the University is Moving Toward Zero Waste


Related Providers

Providers
Waste Transfer Station 
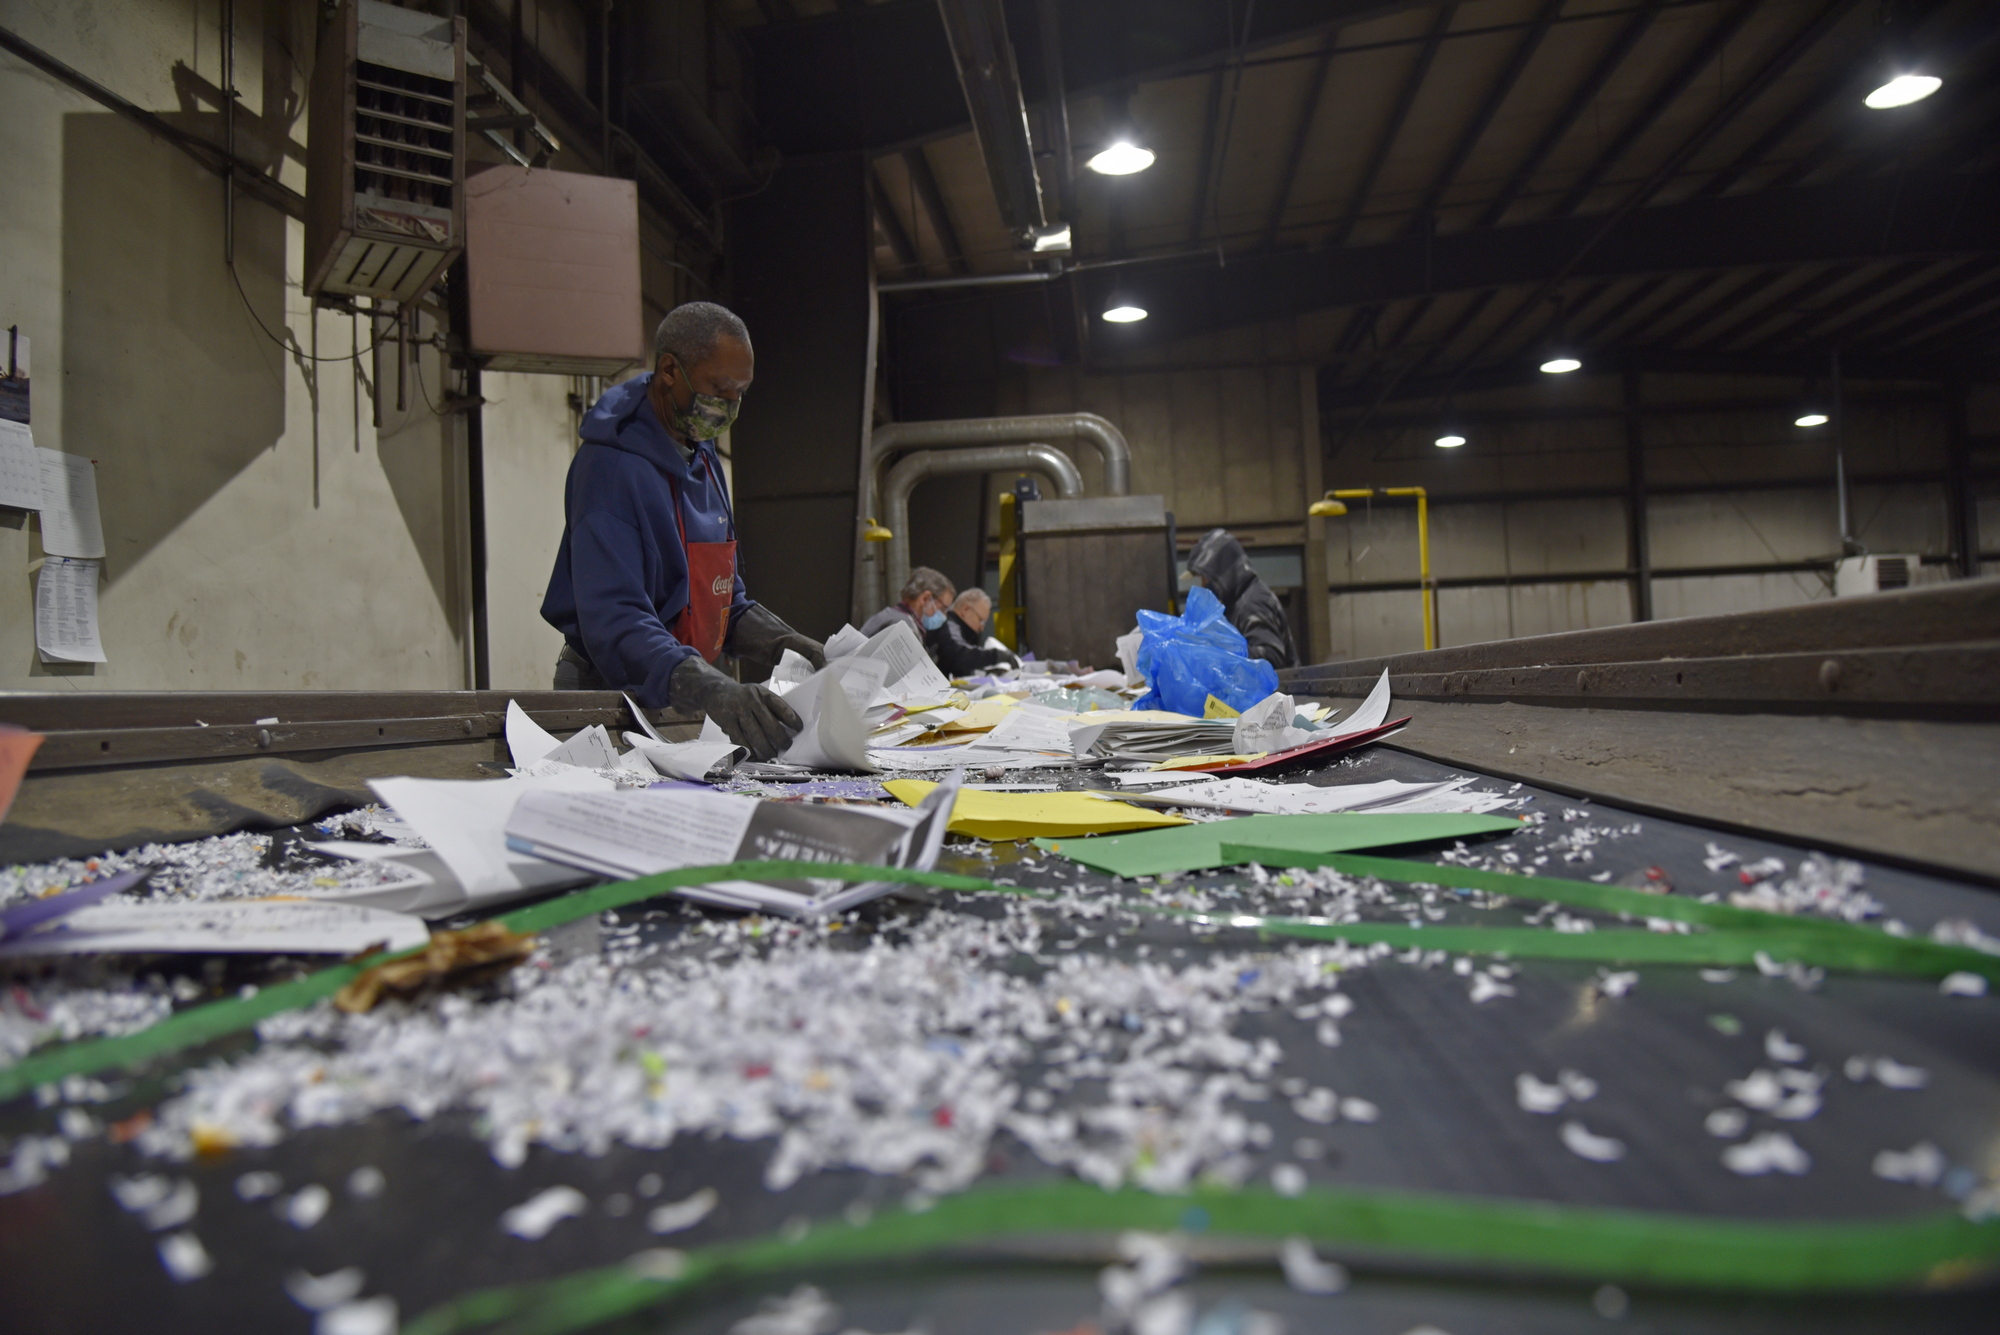
The Waste Transfer Station is at the center of campus waste management and recycling activities. The station supports the overall campus goal to reduce the amount of material entering the waste stream.
Related Services

Related News

F&S Organization
Fighting Illini, Fighting Waste Recycling Numbers

Strategic Initiatives
Campus Waste Characterization Results